Share of Voice Tracking
Share of Voice Tracking for Food and Beverage CPG Brands
How much of the social conversation in your product category does your brand own? Jupiter tells you and shows you exactly where competitors are gaining or losing ground.
On this page
▼
- Most Food CPG Brands Are Flying Blind on Competitive Social Intelligence
- How Jupiter's Share of Voice Tracking Works
- What You See in Your Share of Voice Dashboard
- Your SOV Percentage
- SOV Breakdown Table
- Mention Trend Chart
- Owned vs. Earned Donut Chart
- Platform Breakdown
- Top Content by Engagement
- How to Use Share of Voice Data to Make Better Marketing Decisions
- Identify Competitive Surges Early
- Benchmark Your Influencer Investment
- Find Platform Gaps
- Prove the Value of Your Influencer Program
Most Food CPG Brands Are Flying Blind on Competitive Social Intelligence
Without share of voice tracking, food CPG marketing teams have no way to know whether their social and influencer investment is growing their brand's presence relative to competitors, or whether a competitor is quietly capturing the category conversation.
Jupiter's share of voice dashboard gives food brands a continuous, automated view of where they stand in the social conversation and where competitors are moving.
How Jupiter's Share of Voice Tracking Works
Step 1: You add your brand in Account Assets on Jupiter.
Step 2: Jupiter automatically identifies your product category and discovers your top competitors in that category.
Step 3: Jupiter begins tracking social mentions across Instagram, TikTok, YouTube, and X (Twitter).
Step 4: Your share of voice dashboard populates within 24 hours and updates continuously.
There is no manual setup of competitor lists, no keyword configuration, and no data pipelines to maintain. Jupiter's system does the discovery and tracking automatically.
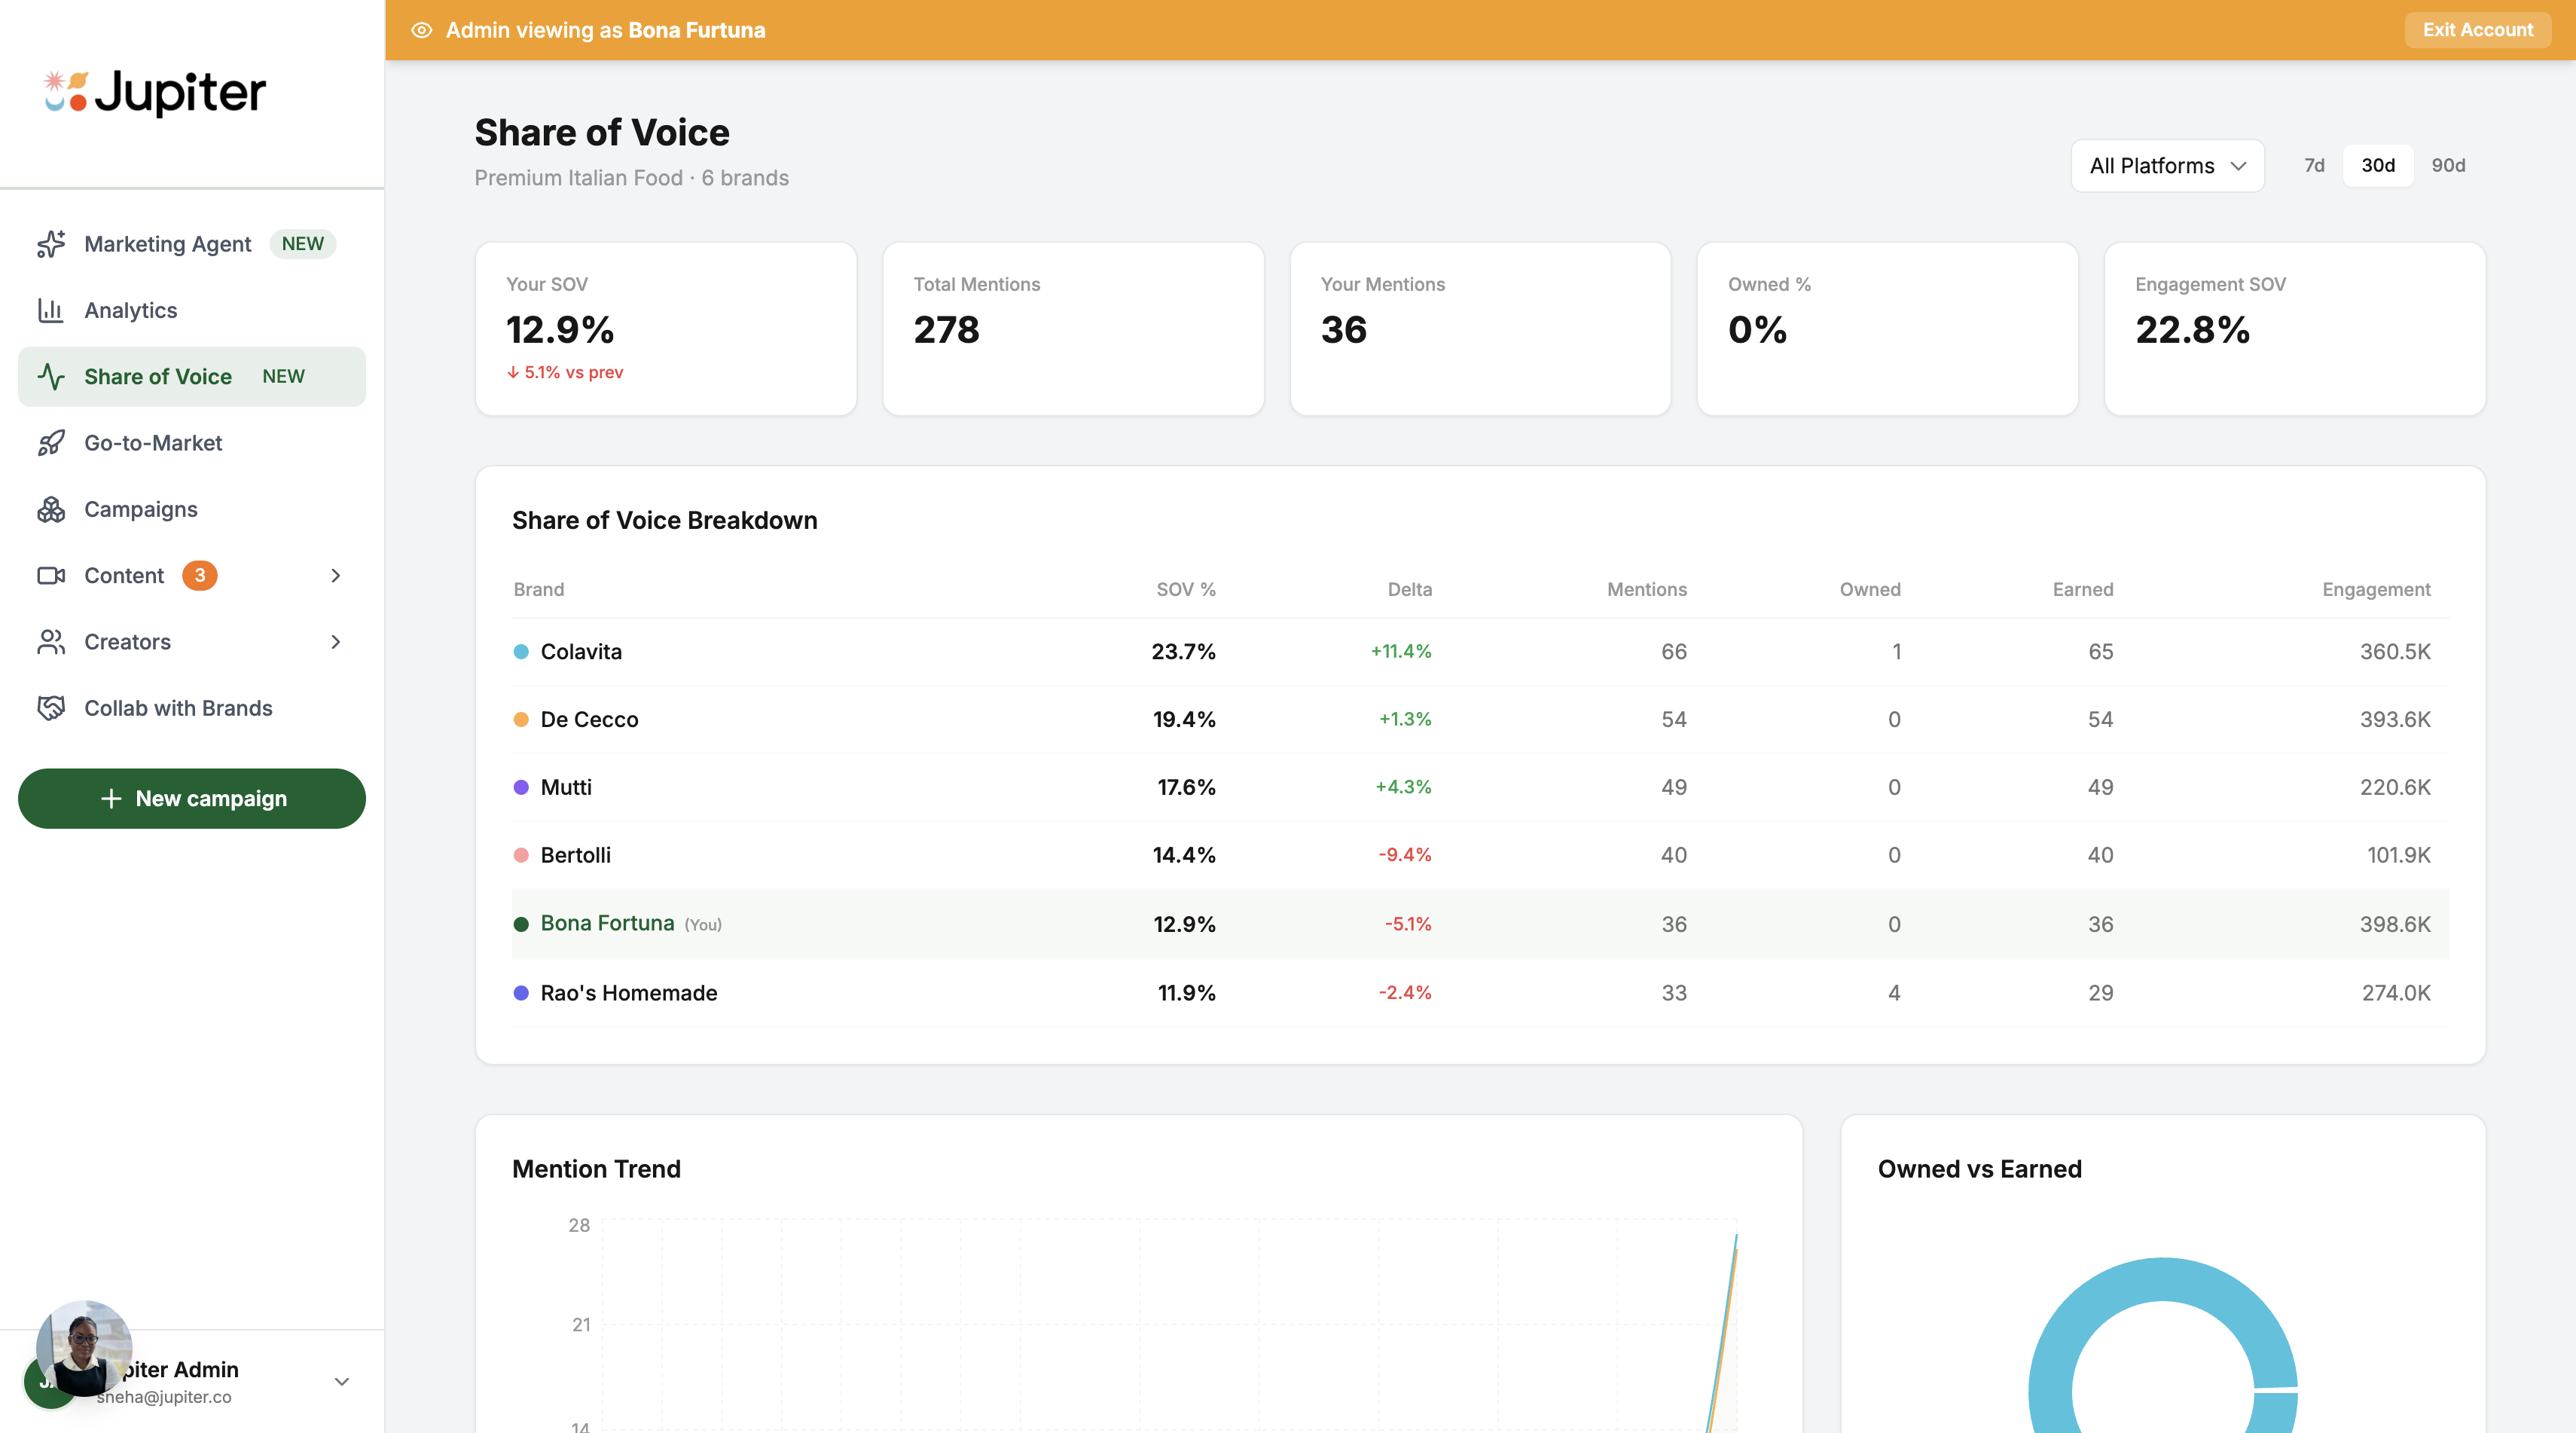
What You See in Your Share of Voice Dashboard
Your SOV Percentage
Your brand's share of total category mentions, expressed as a percentage of all mentions across all tracked brands in your category. Shown with a delta vs. the previous period so you can see whether your share is growing or declining.
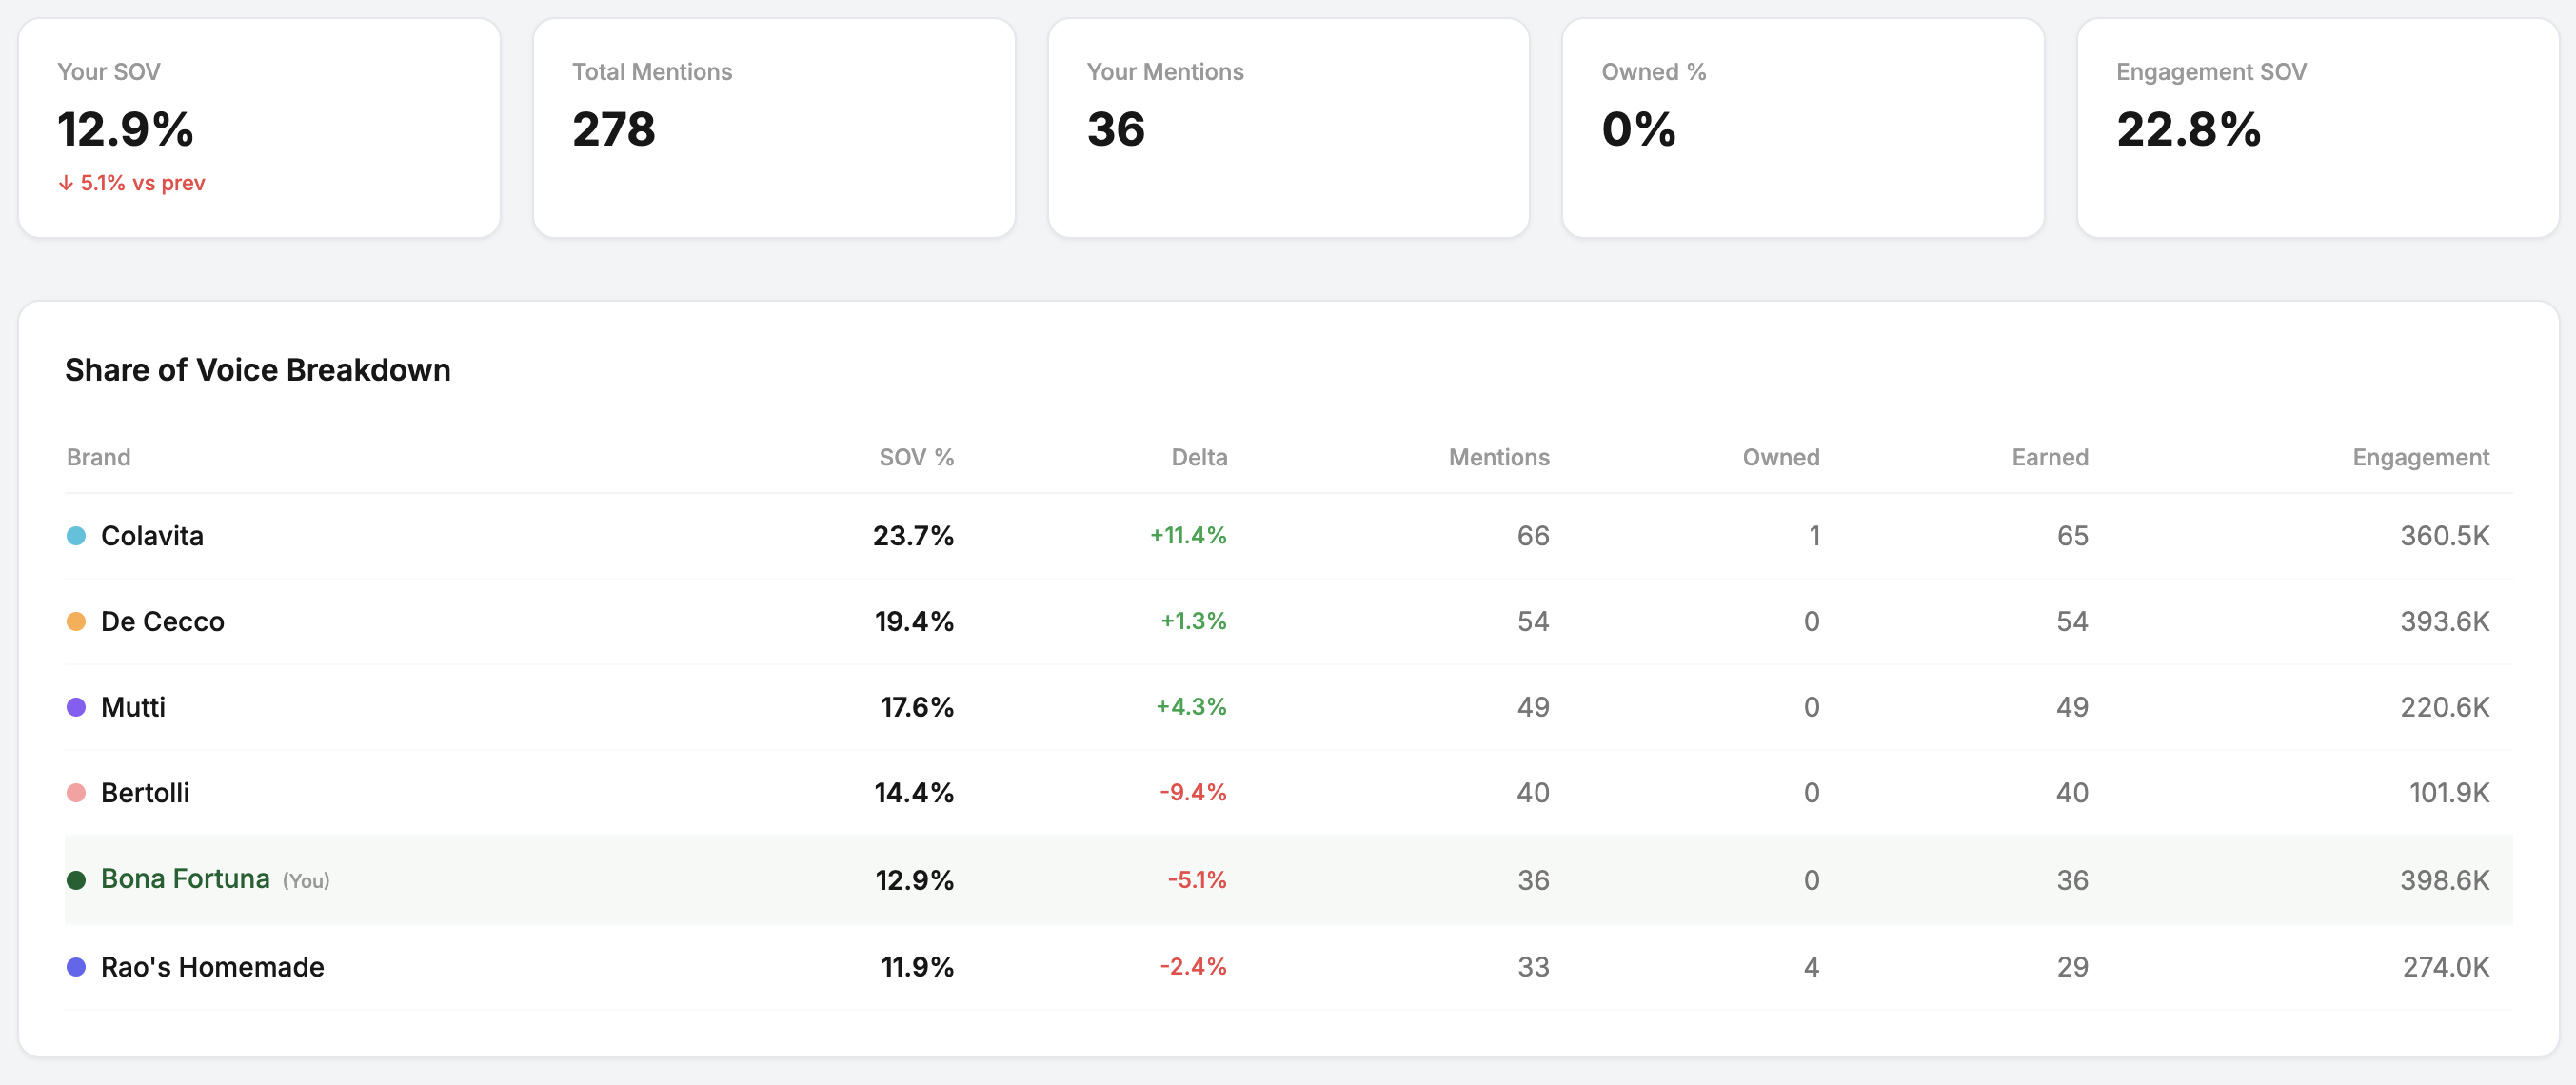
SOV Breakdown Table
Every tracked brand side by side, your brand and your competitors, showing SOV percentage, period-over-period delta, total mentions, owned mentions (content your brand posted), earned mentions (organic content from creators and consumers), and total engagement. Your brand is highlighted so you can quickly compare your position.
Mention Trend Chart
An area chart showing each brand's mention volume over 7, 30, or 90 days. See exactly when a competitor surged, tied to a campaign, a product launch, or a cultural moment, and compare it to your own trajectory.
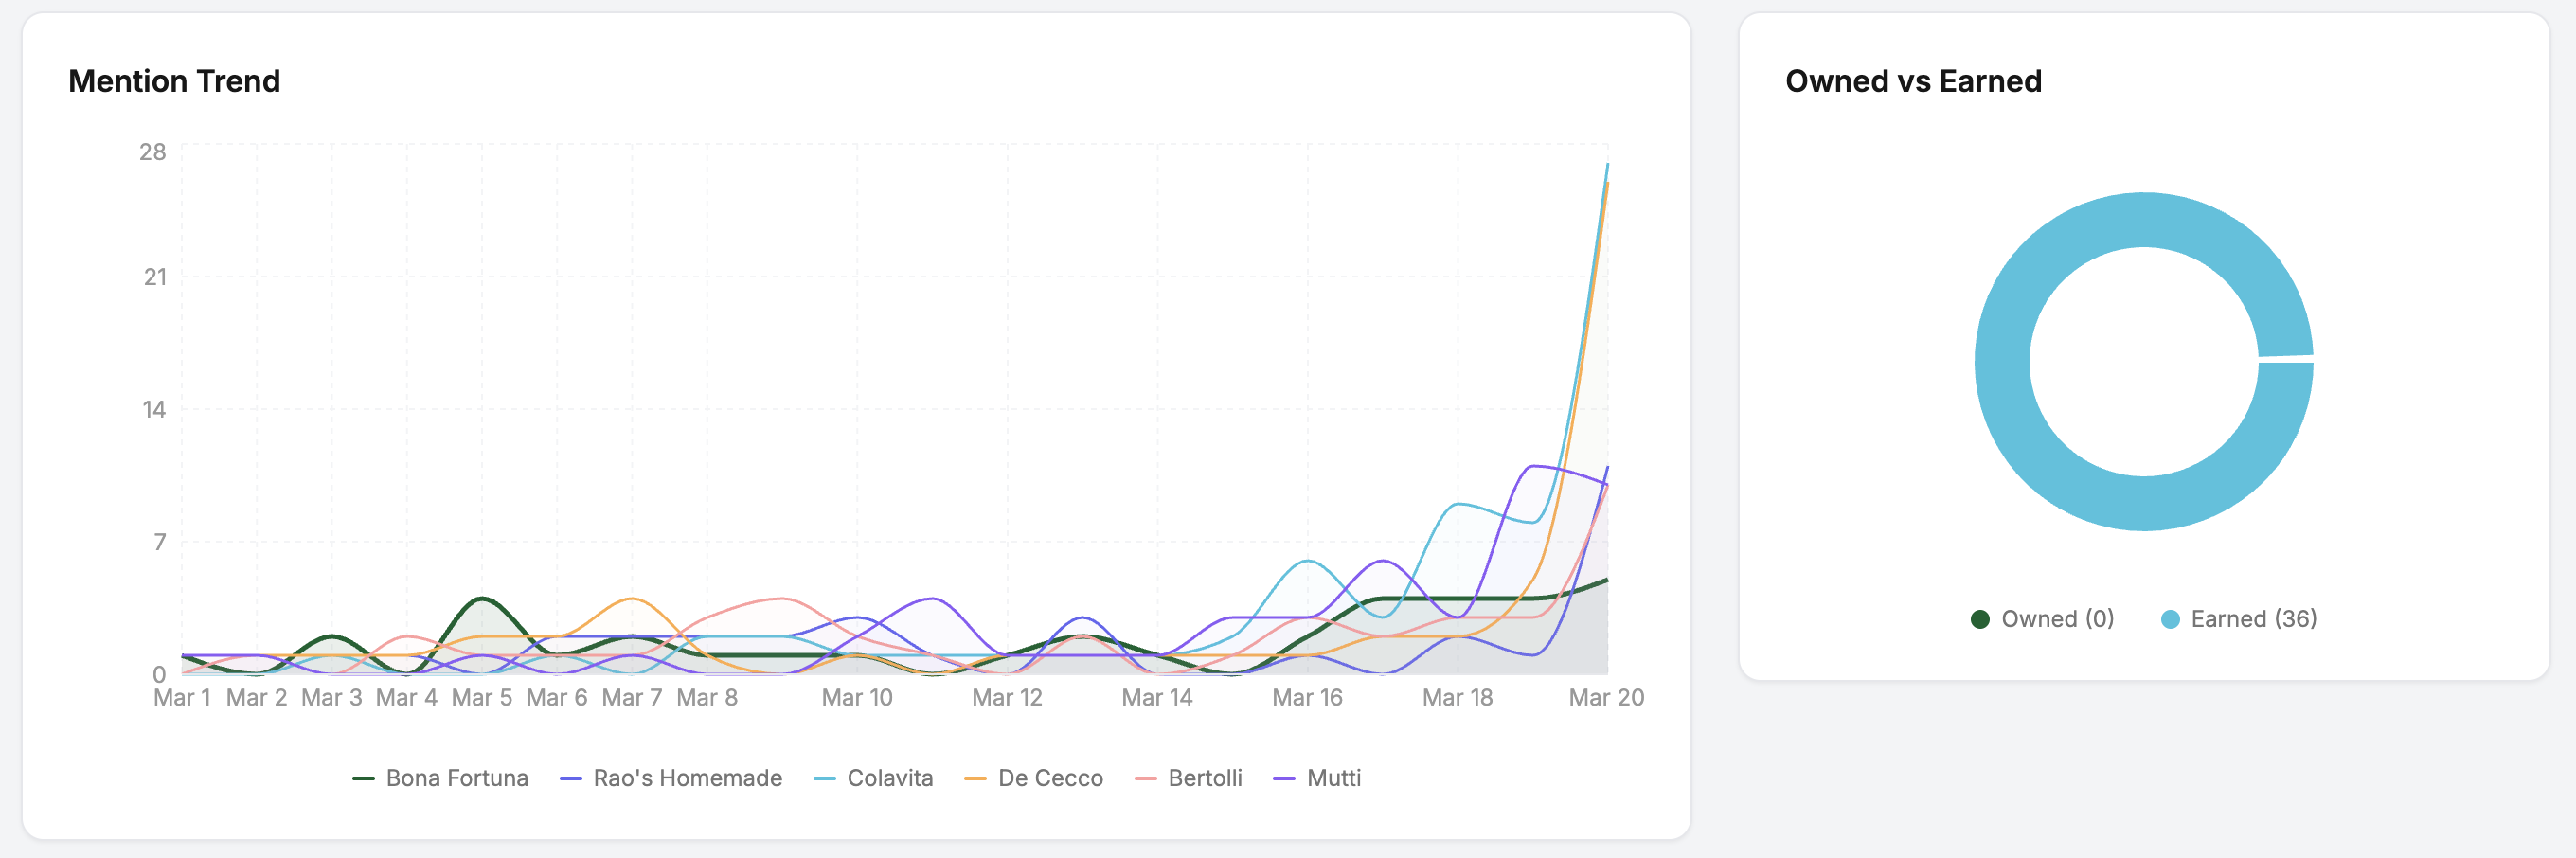
Owned vs. Earned Donut Chart
What percentage of your brand mentions did you generate directly through your own channels? What percentage came organically from creators, consumers, and press? This ratio tells you whether your influencer and owned media investment is generating a multiplier effect in the social conversation.
Platform Breakdown
A stacked bar chart showing where the category conversation is happening across Instagram, TikTok, YouTube, and X. Identify whether you are overindexed or underindexed on any platform relative to competitors and where the opportunity is to expand your presence.
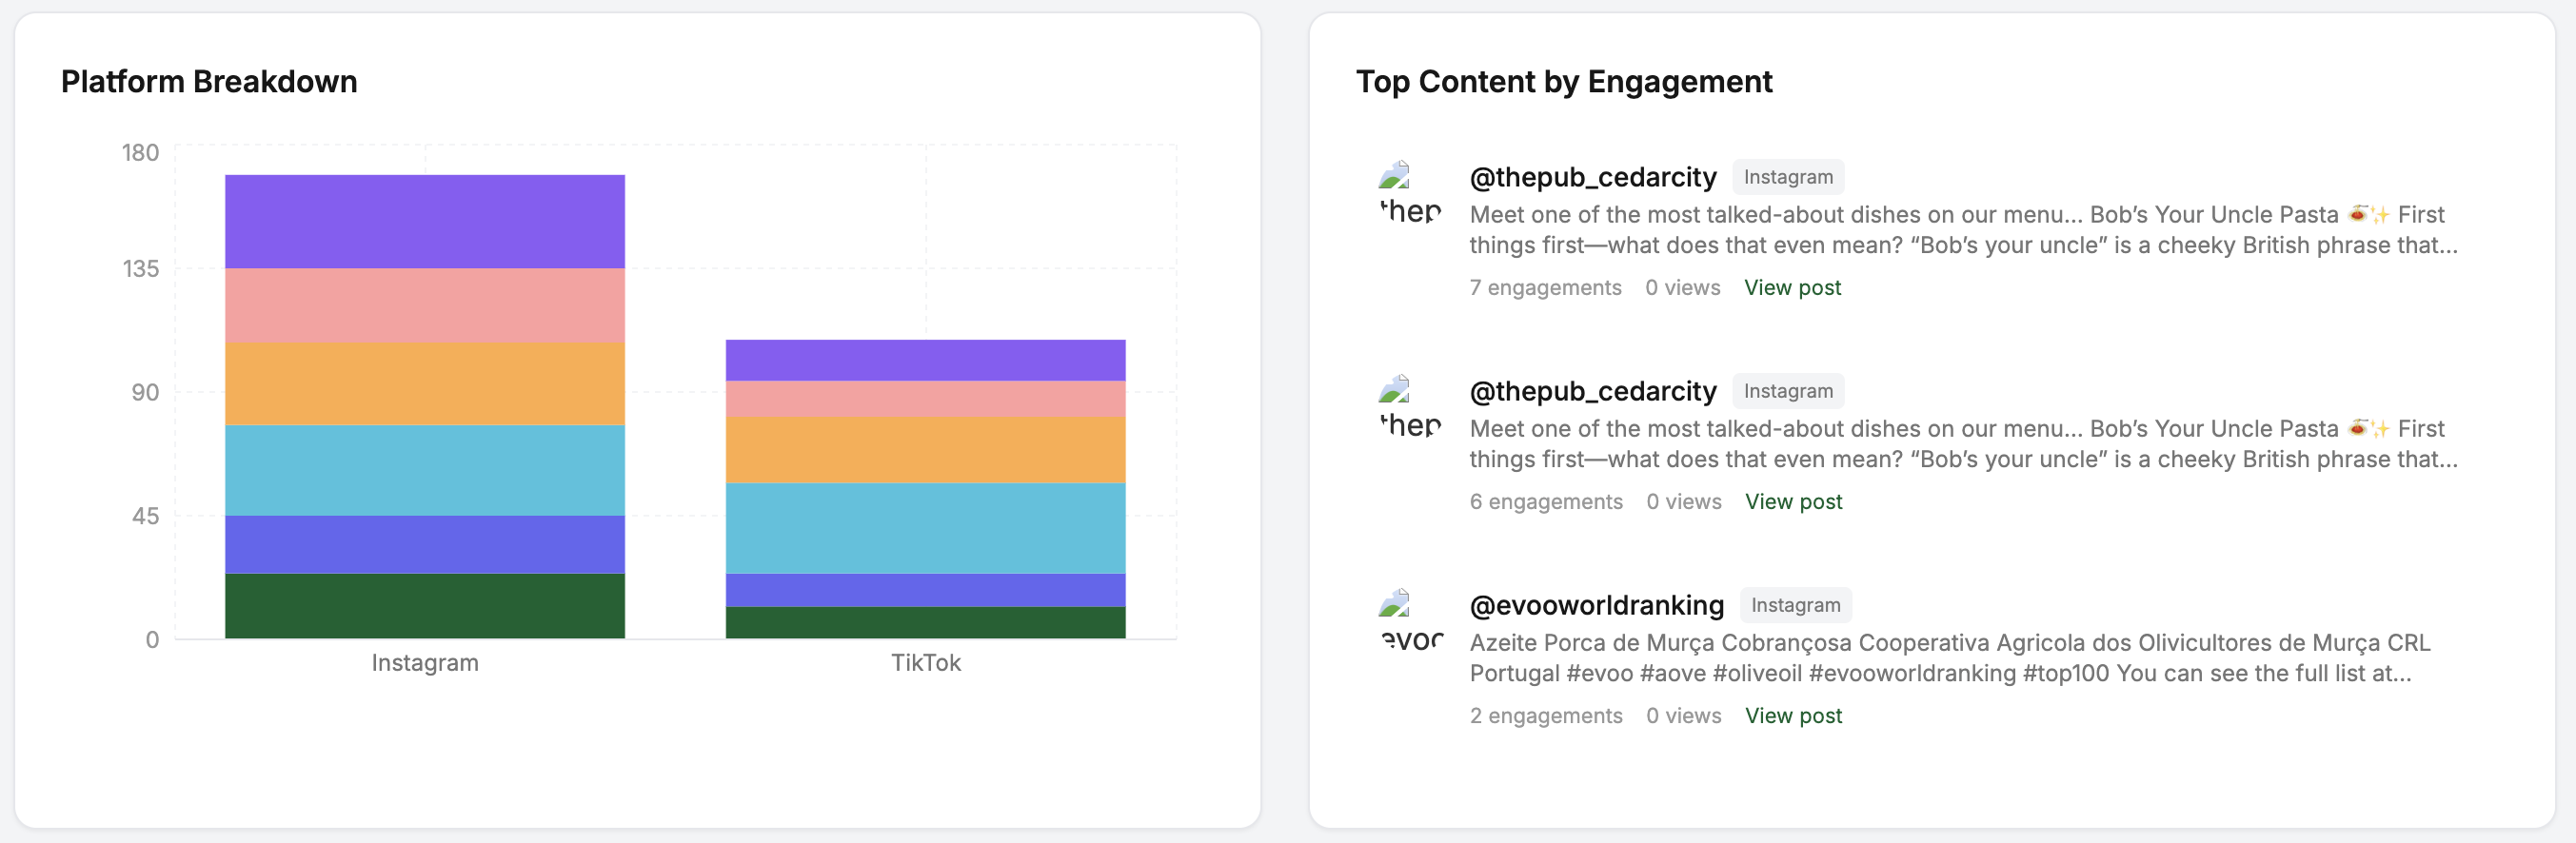
Top Content by Engagement
The highest-engaging posts in your product category across all tracked brands, including competitor content. See what is resonating with your shared audience, who is creating it, and whether it is brand-owned or earned organic content. Use this to identify content formats, creators, and topics that are working across the category.
How to Use Share of Voice Data to Make Better Marketing Decisions
Identify Competitive Surges Early
When a competitor's mention volume spikes, it usually means they launched a campaign, introduced a new product, or caught a cultural moment. Knowing this within days rather than discovering it weeks later in a quarterly report gives you time to respond.
Benchmark Your Influencer Investment
Compare your owned vs. earned ratio before and after a major influencer campaign. If your earned mentions increased significantly during a campaign window, that is evidence that creator content is generating organic conversation beyond the paid posts themselves.
Find Platform Gaps
If your competitors are generating significant mentions on TikTok and your brand's TikTok share is low, that is an actionable signal. Platform breakdown data shows you where to focus next.
Prove the Value of Your Influencer Program
Share of voice growth is a business-level metric your CMO and leadership team understand. Jupiter's SOV dashboard gives you a clean narrative: before this campaign our SOV was X, after this campaign it is Y. That is how you justify influencer budget.
Know Where You Stand in the Category Conversation — Every Day
Jupiter's share of voice dashboard gives food CPG brands the competitive intelligence to act faster, invest smarter, and prove the value of their influencer program.
Book a demoFAQs
Quick answers to common questions.
What is share of voice in marketing?▼
Share of voice (SOV) in marketing is the percentage of total category conversations, impressions, or mentions that a brand owns relative to all brands in that category. A brand with 35% share of voice owns 35% of all social mentions in its product category. Higher share of voice is associated with higher brand awareness and market share. Jupiter tracks social share of voice for food and beverage CPG brands across Instagram, TikTok, YouTube, and X.
How is share of voice calculated?▼
Social share of voice is calculated by dividing a brand's total social mentions by the total social mentions of all brands in the category, then multiplying by 100 to get a percentage. For example, if your brand received 1,200 mentions and the total for all brands in your category was 5,000, your share of voice would be 24%. Jupiter calculates and tracks this automatically for food CPG brands.
What is the difference between owned and earned share of voice?▼
Owned share of voice refers to mentions that come from a brand's own social media channels, posts published directly by the brand. Earned share of voice refers to mentions from third parties, content creators, consumers, press, and other accounts who mention the brand organically. For food CPG brands running influencer programs, growing earned share of voice is a key measure of campaign effectiveness.
Why should food CPG brands track share of voice?▼
Food CPG brands should track share of voice because it shows whether their marketing investment is growing their presence in the category conversation relative to competitors. A brand can increase its absolute impression count while losing share of voice if competitors are growing faster. Share of voice tracking catches this dynamic and gives marketing teams the data to act before competitive position erodes.
How often does Jupiter update share of voice data?▼
Jupiter's share of voice data updates continuously. When you first add a brand, the dashboard populates within 24 hours. After that, social mention data is collected and updated on an ongoing basis so your competitive intelligence is always current.